Nigeria Electricity Revenue Faces N669bn Collection Gap in 2025
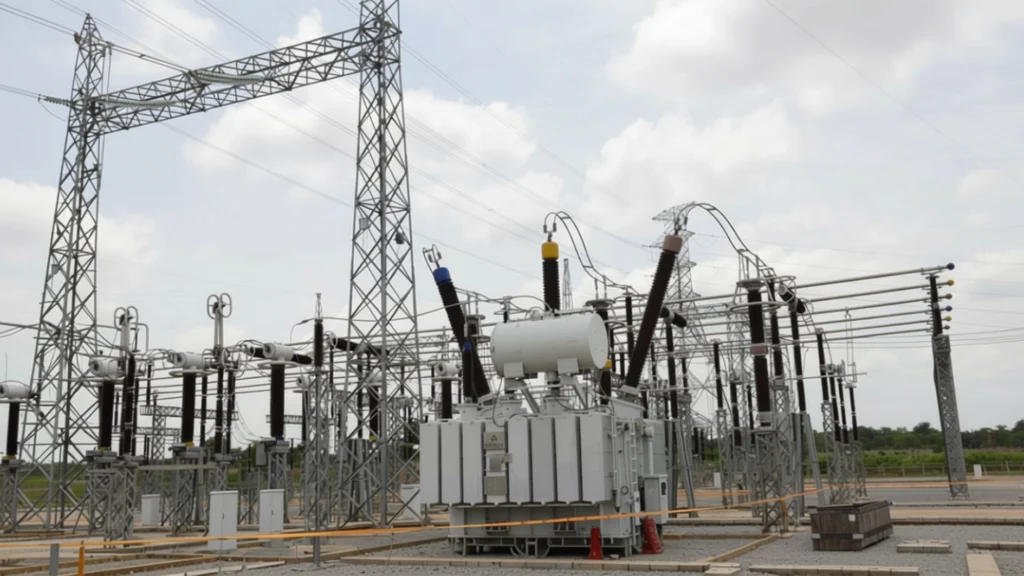
Nigeria’s electricity market generated N2.31 trillion in Disco revenue in 2025, but N669.49 billion remained uncollected, highlighting a major financial weakness in the country’s power distribution system. At the same time, Nigeria received about N87.85 billion from electricity customers in Niger, Togo and Benin, even as the domestic market recorded overall technical, commercial and collection losses well above its regulatory target.
The figures, contained in the 2025 Annual Report of the Nigerian Electricity Regulatory Commission (NERC), offer a detailed picture of a power sector generating substantial financial activity but still struggling to convert electricity supplied and billed into revenue that can be fully recovered.
Electricity Distribution Companies, commonly known as Discos, issued N2.98 trillion in bills to end-use consumers during the year and collected N2.31 trillion. That translated into a national collection efficiency of 77.60 percent, meaning that approximately N22.40 of every N100 billed was not recovered.
The figures also reveal considerable differences between individual distribution companies, with some utilities recording collection efficiencies above 87 percent while others struggled to recover less than half of the value they billed.
At the wider market level, NERC reported an Aggregate Technical, Commercial and Collection (ATC&C) loss of 37.03 percent, significantly above the 20.54 percent benchmark established under the Multi-Year Tariff Order.
The result is a picture of an electricity market in which revenue is being generated on a substantial scale, including through cross-border electricity sales, but where weaknesses in collection and other parts of the electricity value chain continue to constrain financial sustainability.
Nigeria Electricity Revenue Reaches N2.31tn
The domestic retail market remained the largest source of electricity revenue examined in the NERC figures.
Discos collectively billed consumers N2.98 trillion in 2025 and recovered N2.31 trillion. The resulting N669.49 billion gap represents money that was billed but not collected during the period.
The collection rate of 77.60 percent indicates that the industry recovered more than three-quarters of the value billed to consumers, but a significant share remained outstanding.
That distinction is important because billing electricity and collecting payment for it are not the same financial outcome. A Disco can record a substantial amount of electricity sales on paper while still facing cash-flow constraints if consumers do not settle their bills.
The disparity also means that aggregate revenue figures need to be considered alongside collection performance when assessing the financial condition of Nigeria’s electricity distribution market.
The NERC data show that this challenge was not evenly distributed across the country.
Disco Revenue Collection Varied Sharply Across Nigeria
Some distribution companies performed substantially better than others in converting issued bills into actual collections.
Eko Electricity Distribution Company (EKEDC) recorded the highest collection efficiency at 87.90 percent, collecting approximately N424 billion from N482.35 billion billed.
Ikeja Electric followed closely, achieving 87.89 percent after collecting N440.86 billion from N501.61 billion in issued bills.
Benin Disco recorded an 84.17 percent collection efficiency, recovering N202.68 billion from N240.85 billion billed.
At the lower end, the performance was considerably weaker.
Kaduna Disco recorded the lowest collection efficiency at 45.68 percent, collecting only N51.38 billion from N112.48 billion billed.
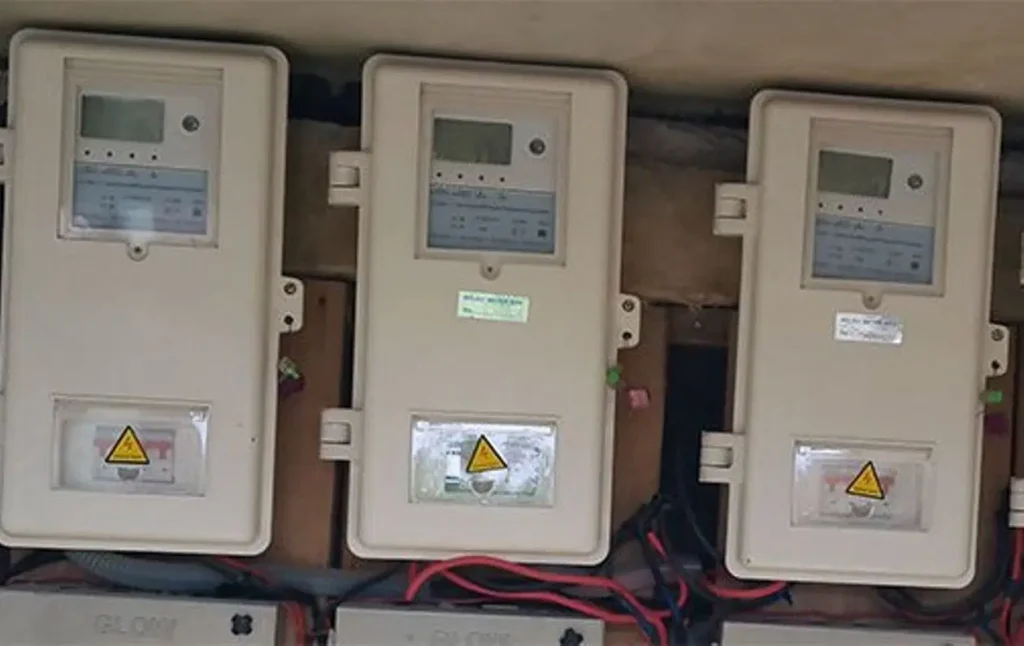
Jos Disco posted a collection efficiency of 46.11 percent, recovering N67.77 billion from total bills of N146.98 billion.
The wide gap between the strongest and weakest performers highlights the uneven commercial realities facing Nigeria’s distribution network.
Collection performance can be influenced by several factors, including the quality of electricity supply, metering, billing accuracy, electricity theft, infrastructure conditions, consumer payment behaviour and the economic characteristics of the areas served. The supplied NERC material identifies tariff recovery, consumer willingness to pay and infrastructure challenges among the factors associated with weaker performance, but does not provide a detailed causal ranking of those factors for each Disco.
Wholesale Payments Tell a Different Story
The financial picture becomes somewhat different when the focus shifts from consumers to the wholesale electricity market.
The Nigerian Bulk Electricity Trading Plc (NBET) and the Market Operator issued a combined N1.721 trillion invoice to the 11 Discos for electricity supply and grid administrative service costs.
Discos remitted N1.63 trillion, representing an overall market remittance performance of 94.80 percent.
That rate was substantially higher than the 77.60 percent retail collection efficiency recorded across the distribution companies.
The difference suggests that payment performance at the wholesale market level was stronger than the rate at which Discos recovered revenue from end-use consumers.
Individual Disco performance also varied.
Eko, Ikeja and Port Harcourt Discos achieved 100 percent remittance compliance to NBET for energy drawn during the year.
Seven Discos—Abuja, Benin, Eko, Enugu, Ikeja, Port Harcourt and Yola—also recorded full 100 percent remittance performance to the Market Operator for service fees.
Kaduna again occupied the weakest position, recording 40.13 percent remittance to NBET and 48.11 percent to the Market Operator.
The contrasting figures demonstrate that the financial pressures within Nigeria’s electricity market cannot be reduced to a single revenue problem. Collection from consumers, payments between market participants and losses across the network operate at different points in the electricity value chain.
Nigeria Electricity Exports Add N87.85bn
While domestic Disco collections reveal a significant revenue gap, Nigeria’s electricity market also generated foreign revenue through bilateral power sales to neighbouring countries.
Nigeria received approximately N87.85 billion, equivalent to $62.75 million, in electricity tariff payments from international bilateral customers in Niger, Togo and Benin in 2025, based on the exchange rate cited in the source report.
The Market Operator issued a combined invoice of $73.91 million to three neighbouring international power utilities:
- Société Beninoise d’Energie Electrique of Benin;
- Compagnie Energie Electrique du Togo; and
- Société Nigerienne d’Electricité of Niger.
The three utilities remitted $62.75 million, representing an overall payment performance of 84.90 percent.
The cross-border payments provide an additional source of foreign exchange and liquidity for Nigeria’s electricity market.
But their significance goes beyond the value of the transactions themselves.
Nigeria’s electricity relationship with its neighbours is linked to wider regional energy arrangements and commitments under the West African Power Pool (WAPP), as well as longstanding considerations surrounding the River Niger and regional water resources.
Why Nigeria Exports Electricity Despite Domestic Challenges
Nigeria’s electricity exports can appear difficult to reconcile with the country’s domestic power challenges. However, the cross-border arrangements have a wider strategic context.
The supplied report links the electricity relationships with Niger, Togo and Benin to regional commitments, geopolitical agreements and arrangements surrounding the River Niger.
The river is particularly important to Nigeria because major hydroelectric facilities, including Kainji, Jebba and Shiroro, depend on adequate water inflows.
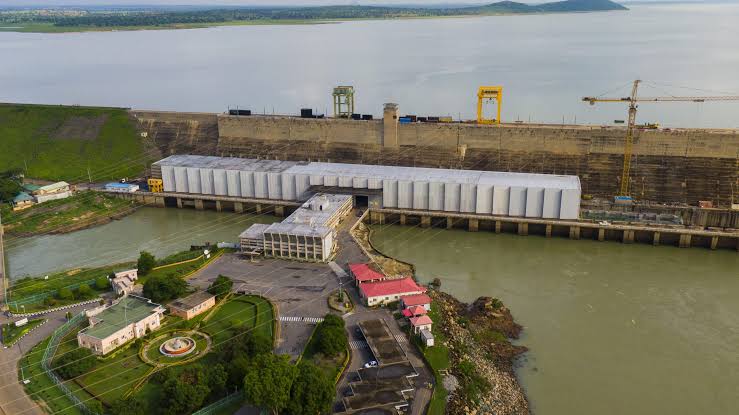
The report states that Nigeria has a longstanding arrangement involving continuous electricity supply to upstream neighbours in connection with commitments concerning the flow of the River Niger. The arrangement is presented as part of a wider strategic calculation involving Nigeria’s downstream interests and hydroelectric capacity.
Under this framework, electricity is not simply a commodity moving across a border in exchange for payment. It can also form part of broader regional energy and resource relationships.
The cross-border electricity trade therefore sits at the intersection of commercial revenue, regional energy cooperation and strategic resource interests.
For Nigeria, the foreign exchange generated from electricity exports also provides financial value at a time when liquidity remains an important issue across the power market.
Nigeria Power Sector Losses Remain Far Above Target
The strongest indication of the sector’s underlying financial challenge comes from its overall loss performance.
NERC reported a weighted average ATC&C loss of 37.03 percent for the Nigerian Electricity Supply Industry in 2025.
That figure was 16.49 percentage points above the 20.54 percent loss benchmark set under the Multi-Year Tariff Order.
The loss measure incorporates technical and commercial losses as well as collection losses across the electricity value chain.
The supplied figures identify an 18.86 percent technical and commercial loss and a 22.40 percent collection loss.
Technical and commercial losses include electricity delivered but not properly billed because of factors such as network losses, theft and inaccurate metering. Collection losses represent energy that has been billed but whose corresponding revenue has not been recovered.
The figures underline why the sector’s financial performance cannot be assessed solely by looking at how much electricity is billed or how much revenue appears in aggregate collection figures.
A market can record significant billing and collection volumes while still losing substantial value between electricity generation, transmission, distribution, metering, billing and payment.
The N669bn Gap Is More Than a Collection Figure
The N669.49 billion uncollected balance provides one of the clearest indicators of the challenge facing the distribution segment.
It represents the difference between the N2.98 trillion billed to consumers and the N2.31 trillion actually collected.
For electricity companies, collection is central to the ability to meet financial obligations and maintain operations. Revenue that remains unpaid cannot perform the same function as cash received.
The disparity between the Discos also suggests that national averages can conceal significant differences in commercial performance.
Eko and Ikeja recorded collection efficiencies close to 88 percent, while Kaduna and Jos were below 47 percent.
That spread points to different operating environments across Nigeria’s electricity distribution territories.
The figures alone, however, do not establish that geography is the sole reason for the disparity. They show the outcome, while the precise weight of infrastructure, customer behaviour, metering, theft, supply reliability and other factors requires more detailed analysis.
What the Figures Mean for Nigeria’s Power Market
Taken together, the NERC figures show an electricity market with substantial financial activity but persistent weaknesses in revenue recovery and loss management.
Domestic consumers generated N2.31 trillion in Disco collections, while international bilateral customers contributed approximately N87.85 billion in electricity tariff payments.
Wholesale market remittances reached N1.63 trillion, with a 94.80 percent overall remittance performance.
Yet the sector still recorded a 37.03 percent ATC&C loss, significantly above its 20.54 percent benchmark.
The contrast matters because the long-term financial health of an electricity market depends not only on how much electricity is generated and sold, but also on how efficiently the system captures the economic value of that electricity.
Nigeria’s electricity revenue therefore needs to be viewed across the entire chain—from generation and transmission to distribution, metering, billing, collection and market settlement.
Weakness at any stage can reduce the amount of money available to sustain the system.
The 2025 figures also demonstrate that improvements are possible. The performance of Eko, Ikeja and other Discos shows that stronger collection and remittance outcomes can be achieved within the existing market framework.
The challenge is how to narrow the gap between the strongest and weakest performers while reducing losses across the industry.
A Power Sector With Revenue but Significant Leakage
Nigeria’s electricity market entered 2025 with a financial contradiction.
It generated N2.31 trillion in domestic Disco collections, received N87.85 billion from electricity customers in three neighbouring countries, and recorded a 94.80 percent wholesale market remittance rate.
Yet N669.49 billion in billed domestic revenue remained uncollected, while total ATC&C losses reached 37.03 percent—far above the regulatory benchmark.
The figures suggest that Nigeria’s power-sector challenge extends beyond generating electricity or increasing the amount billed to consumers. The ability to capture, collect and retain the value created throughout the electricity supply chain remains equally important.
The international electricity payments add another dimension to the picture. Nigeria is not only a domestic electricity market but also a participant in a regional power system in which electricity trade can generate foreign revenue while supporting wider energy and resource arrangements.
For the sector to become more financially sustainable, the gap between electricity supplied, electricity billed and revenue actually collected will remain a critical measure.
The 2025 NERC figures make that gap difficult to ignore: billions of naira are moving through Nigeria’s electricity market, but hundreds of billions of naira are still failing to make the journey from billing to collection.
Recommended Coverage
1. Timipre Sylva Properties Face EFCC Forfeiture
2. PFIP C Scandal: N1.3bn Budget Oversight Gaps
3. Yahaya Bello Trial Faces Fresh School Fees Controversy
About the Author